Contents
2026 World Cup Stats Guide: The Football Stats That Coaches Should Actually Pay Attention To
- Nathan George
- Game data
During a World Cup, most people watch the ball.
Trainers look at everything around them.
You see the winger starting his run before the pass is played. The center-back who leans in five meters too early. The midfield line that appears organized until a single pass bypasses it. The striker who presses with a lot of energy but has no support behind him.
That's precisely why the 2026 World Cup is not just a tournament of goals, stars, and great moments. It's also a tournament of data.
The Technical Study Group FIFA will analyze all 104 games, with access to six camera angles and thousands of live data points per game. FIFA Enhanced Football Intelligence Furthermore, significantly more detailed metrics have entered football, including Expected Goals, line breaks, time to ball recovery, pressures on the ball, forced turnovers, team structure, and carries beyond the defensive line.
This is where it gets interesting for trainers.
The best statistics don't make soccer more complicated. When used correctly, they make the game easier to understand.
Why World Cup statistics go beyond possession and shots on goal

Possession was long one of the most important statistics after a game.
It still tells part of the story, but only a small part.
One team can have a lot of possession and still create very little danger. Another team can have less possession but create better chances, win the ball back in more dangerous areas, and attack more purposefully.
That’s why coaches are taking a closer look these days. They want to know where possession occurred, how the opponent moved the ball, how quickly a team reacted after losing possession, and whether runs actually influenced the game.
The question is no longer just: Who had more possession?
Rather: Who made better use of the space?
Expected Goals: useful, but not the whole story when it comes to offense
Expected Goals, or xG, is everywhere during the 2026 World Cup.
The value is popular because it answers a simple question: How good were the odds?
A shot from two meters out shouldn’t be evaluated the same way as a shot from outside the penalty area. xG assigns a value to every chance that indicates how likely it is to result in a goal. Over a longer period of time, this helps coaches determine whether a team is creating truly dangerous chances or simply taking shots from less promising positions.
But xG is also often overinterpreted.
A team can have a high xG value due to a penalty kick or a single big chance without having posed much of a threat from open play. A forward might miss a high-quality chance because the pass is slightly behind him, the shot is rushed, or the goalkeeper does an excellent job of closing down the angle.
So xG is useful, but not definitive.
The value tells coaches something about the quality of the chances. But it doesn't explain the entire offense.
Pressing data: when effort becomes organization

Pressing is one of the areas where statistics can reveal more than what you can see with the naked eye during a live game.
Everyone sees when a forward sprints at a center-back. It's harder to tell if the rest of the team is working with him.
Does the winger mark the full-back? Does the midfield push up? Does the defensive line push forward? Or does a single player press while the rest of the team stays too deep?
At a World Cup level, these are exactly the kinds of details that make the difference. Pressing doesn't just mean running a lot. It's about timing, spacing, and connection between the players.
Metrics such as time to ball recovery, pressure on the ball, and forced turnovers are therefore valuable. They show whether a team is truly disrupting the opponent or merely appearing aggressive.
High-pressing that wins the ball near the goal is easy to praise. But a clever midfield block that forces the opponent wide for 20 minutes can be just as important.
Data helps coaches distinguish between visual effort and actual control.
Breakaways: The Passes That Change the Game
Some of the most important actions in soccer don't show up as goals or assists.
A center back plays through the first line of pressure. A midfielder receives the ball behind the opposing midfield. A winger takes the ball behind the fullback. Suddenly, the entire structure of the game changes.
That is precisely where the value of breaking the lines and receiving the ball behind the lines lies.
These statistics show how often a team moves the ball past the opponent's defensive line. Not just across the field. Not just safely from one player to the next. But right through the opponent's defense.
This is especially exciting at a World Cup, because teams face opponents with very different playing styles. Some opponents sit deep and play compactly. Some press high up the field. Some protect the center of the field, leaving space open on the wings. The teams that succeed are often the ones that find the right way through, around, or behind this structure.
A team can make 500 passes and still fail to exploit the key areas.
A clean first touch between the lines can do more damage than twenty safe passes between center backs.
Final-Third Entries: Just getting there doesn't mean you're a threat
Final-Third Entries just sound simple: How often does a team get the ball into the final third?
But it really gets interesting when you look at the type of entry.
Was it a precise pass to a player who was able to turn? A cross in the hope of a chance? A dribble after winning the ball? A long ball into space? A fullback making a late run after a shift in play?
Two teams can have similar statistics for final-third entries yet look completely different. One team advances into the final third in a controlled manner and creates cutbacks. The other repeatedly reaches wide areas but has no one in the penalty area.
That's precisely why this statistic is helpful for coaches. It sparks a better discussion.
Are we entering dangerous areas with enough support? Are our wingers isolated? Do we reach the final third but not create real chances?
These are questions that any club can ask itself, not just national teams.
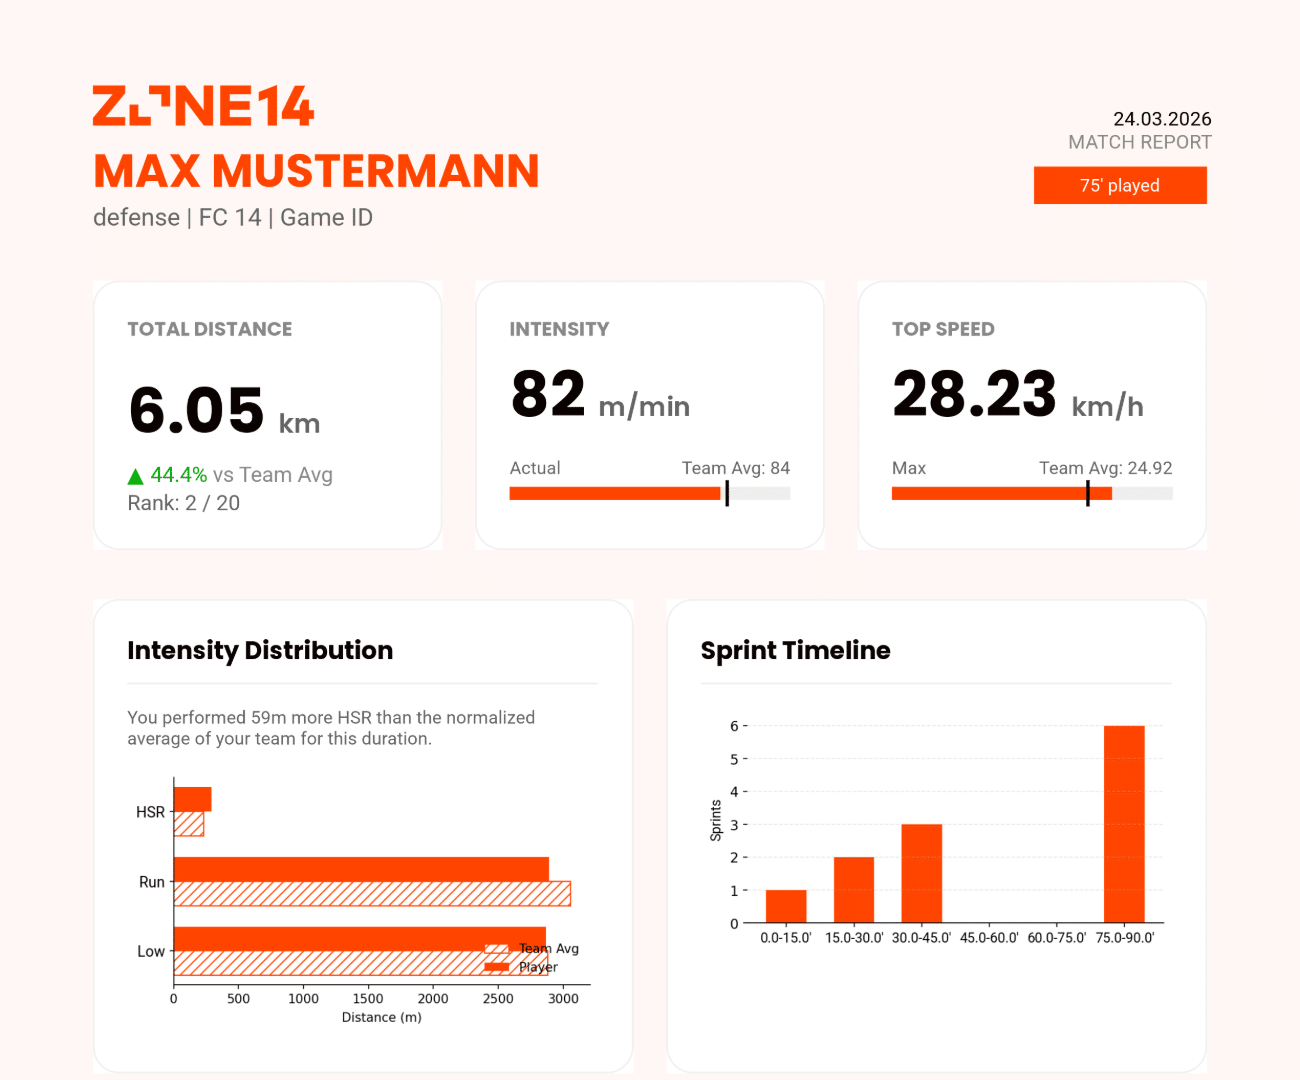
Sprint Maps and High-Intensity Runs
Running data receive a lot of attention at major tournaments.
But the total distance is often a rough estimate.
One player can run twelve kilometers without really changing the game. Another runs less overall but has five decisive high-intensity actions: a recovery sprint, a run in behind, a counter-press, a cover tackle, or a run into the box.
Sprint maps and data on high-intensity runs are therefore more interesting than distance alone. They show where the demanding actions took place.
With a winger, the sprint map can show whether they attacked the space behind the full-back or were almost exclusively played into their feet. With a full-back, it can show whether they supported attacks, sprinted back after turnovers, or spent the entire game chasing.
GPS systems have helped clubs understand physical performance better for years. They remain valuable, especially when it comes to load management in training and games.
However, for coaches, it's not just about how far a player has run.
What these runs meant in the game is crucial.
Heatmaps: useful, but dangerous if taken too literally
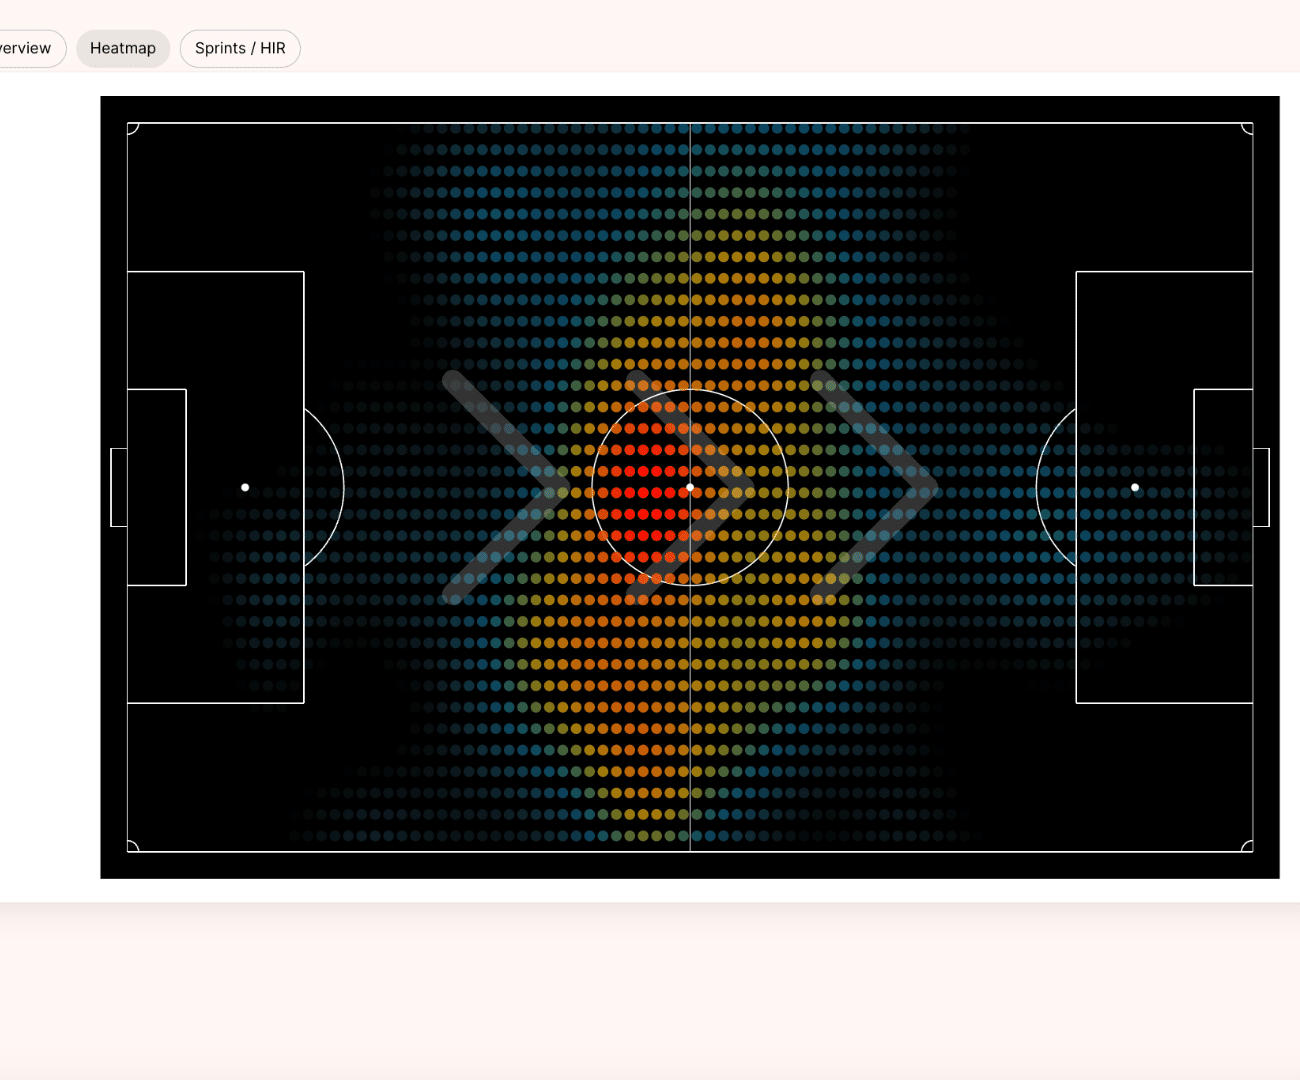
Heatmaps are among the statistics that are quickest to understand.
They show in which areas a player was active. This makes them helpful for role analysis. Did the left-back push up? Did the winger stay wide? Did the striker drop into midfield? Did the defensive midfielder cover both sides of the pitch?
At the World Cup, heatmaps help to better classify player roles, especially for flexible fullbacks, inverted wingers, and midfielders who rotate into different spaces.
However, heat maps need to be read carefully.
A full-back who stays high for most of the game can be a sign of offensive dominance. But it can also mean his team is constantly chasing the game. A striker who drops deep can help the team link up attacks. Or it can mean there's no one left in the box.
The heatmap is not the conclusion. It is a hint.
Team Cohesion: The Statistic Coaches Should Pay Even More Attention To
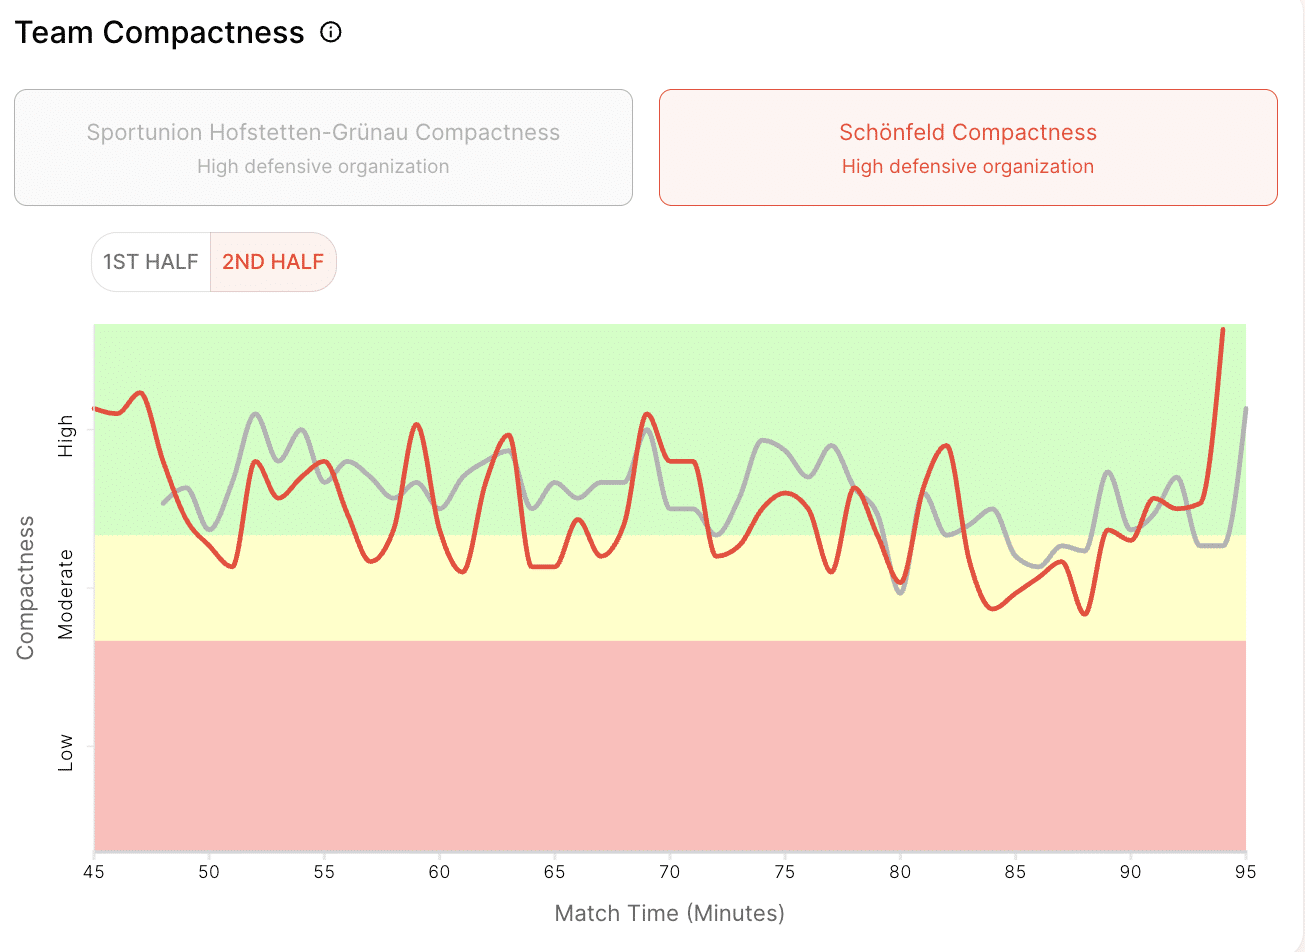
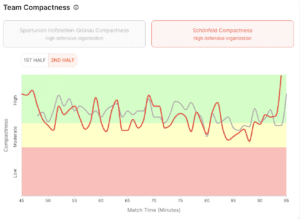
If there is one team statistic that coaches should pay particular attention to at the World Cup, it is compactness.
Compactness describes the distances between players and team units. How close is the midfield to the defense? Are the strikers connected to the rest of the team? Does the team protect central spaces or get pulled apart?
Good compactness helps with pressing. It helps in counter-pressing. It makes second balls easier to reach. And it reduces the spaces through which the opponent can play.
At World Cup level, that can make the difference between a controlled and a chaotic game.
If a team loses its compactness, spaces open up between the lines. Suddenly, a pass can bypass four players. A midfielder can turn. A center-back has to step out. The last line drops back. The entire team is now only defending towards their own goal.
These are the details coaches talk about long after the highlights.
It is also one of the clearest examples of why team statistics are becoming increasingly useful outside of professional football. Compactness is not an abstract number. It is something players can see immediately when the right moment is shown in the video.
The real lesson: statistics are starting points, not answers
This point should not be lost.
Statistics help coaches, to find a pattern. They don't coach the team themselves.
A low number of sprints might seem concerning. Perhaps the player's role was different. Perhaps the team never created the spaces he could have run into. Perhaps the opponent was so deep that there was no space behind the last line.
Many final-third entries might look positive. But perhaps most of them ended in poor crosses from unfavorable angles.
A high pressing value can indicate intensity. However, the team behind the press might have constantly opened up spaces and only got lucky that the opponent didn't exploit them.
That's why the best analysis is never just numbers or just video. It's the combination.
Data directs the coach's attention to a pattern. Video shows the specific moments. The coaching team decides what is truly relevant, what can be improved, and what belongs on the training pitch.
From the World Cup analysis rooms to everyday clubs
National teams have analysts, data providers, Tracking Systems, multiple Camera perspectiven and experienced staff members. During the World Cup, they utilize this support to prepare opponents, evaluate performance, and understand the small details that decide games.
Most clubs don't have this setup.
But the gap is getting smaller.
Amateur, academy, and semi-professional clubs are already using video much more consciously. They record games, edit key scenes, and provide players with visual feedback. The next step is to integrate useful statistics into this process.
For some clubs, GPS Systems the right way. They can be especially helpful for physical preparation and load management.
For other clubs video-based statistics a more practical start. The game will be recorded anyway. The players don't have to carry anything. The data is generated from the video material and can be directly linked to the game.
This is how statistics become less daunting.
You are no longer something only analysts belong to.
You will be part of the normal coach discussion.
How zone14 STATS helps

This is precisely where zone14 STATS into the game.
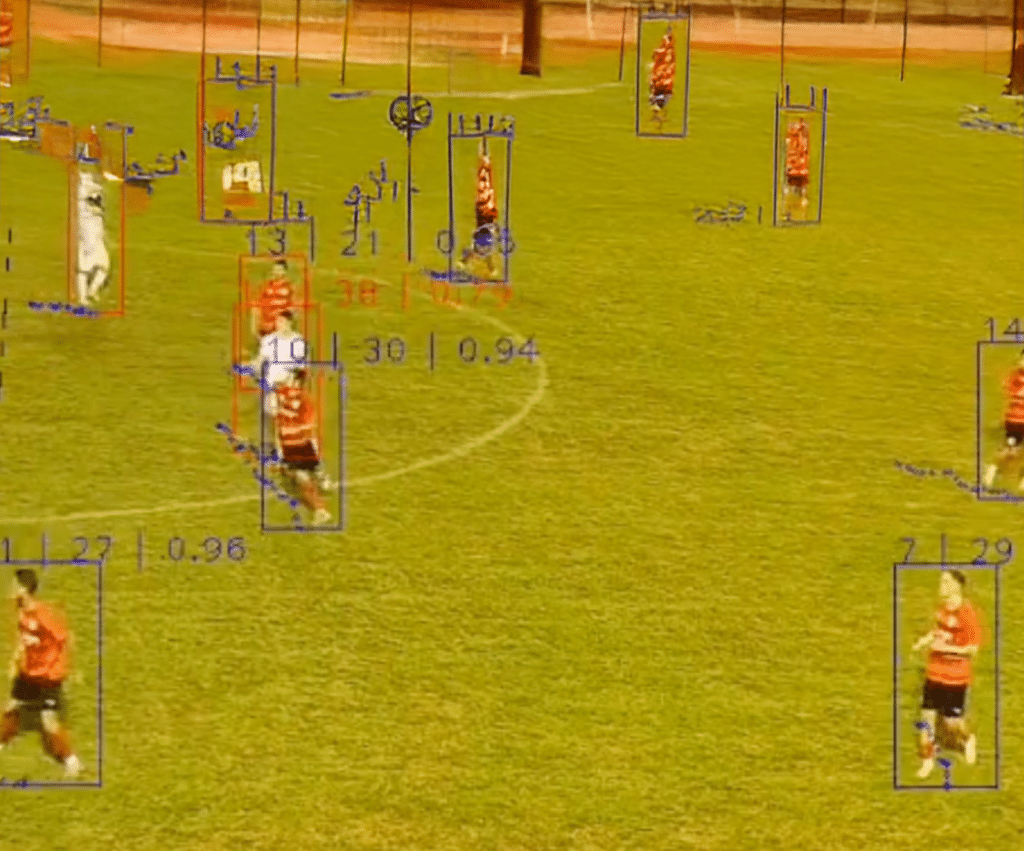
With zone14 STATS, clubs can transform match videos into performance and tactical data. This includes distances, sprints, sprint maps, Heatmaps, Team cohesiont, Team dominance and individual player reports.
Without GPS vests. Without additional hardware on site. Without manual tagging from the start.
For trainers, the benefit is practical.
Before a feedback session, a player report can help find the right scenes. Sprint maps can show if a winger attacked the right spaces. Heatmaps can support conversations about positioning and role discipline. And team compactness can reveal when the gaps between players helped – and when they opened up the game too much.
It's not about turning every club into a data department.
It's about making statistics useful for the people who actually work with the team.
Conclusion
The 2026 World Cup will showcase soccer at the highest level. It also demonstrates how deeply the game is understood through data today.
The lesson for clubs, however, is not that they need every available statistic.
You need the right statistics—the ones that help coaches ask better questions, find clearer examples, and give players feedback they can understand.
This could be a sprint map. A heatmap. A compactness metric. A player report. Or a simple number that sparks a much better discussion.
When used correctly, soccer statistics do not take the game away from coaches.
You bring the important moments into focus.
More related content from zone14