zone14 STATS
Football tracking like the pros. Without GPS vests.
zone14 STATS automatically turns your match video into performance data, sprint maps, heatmaps, team metrics and individual player reports — no wearables, no extra hardware on the pitch and no manual tagging.
- Distance & sprints
- Heatmaps & sprint maps
- Team compactness & dominance
- From €79 per month
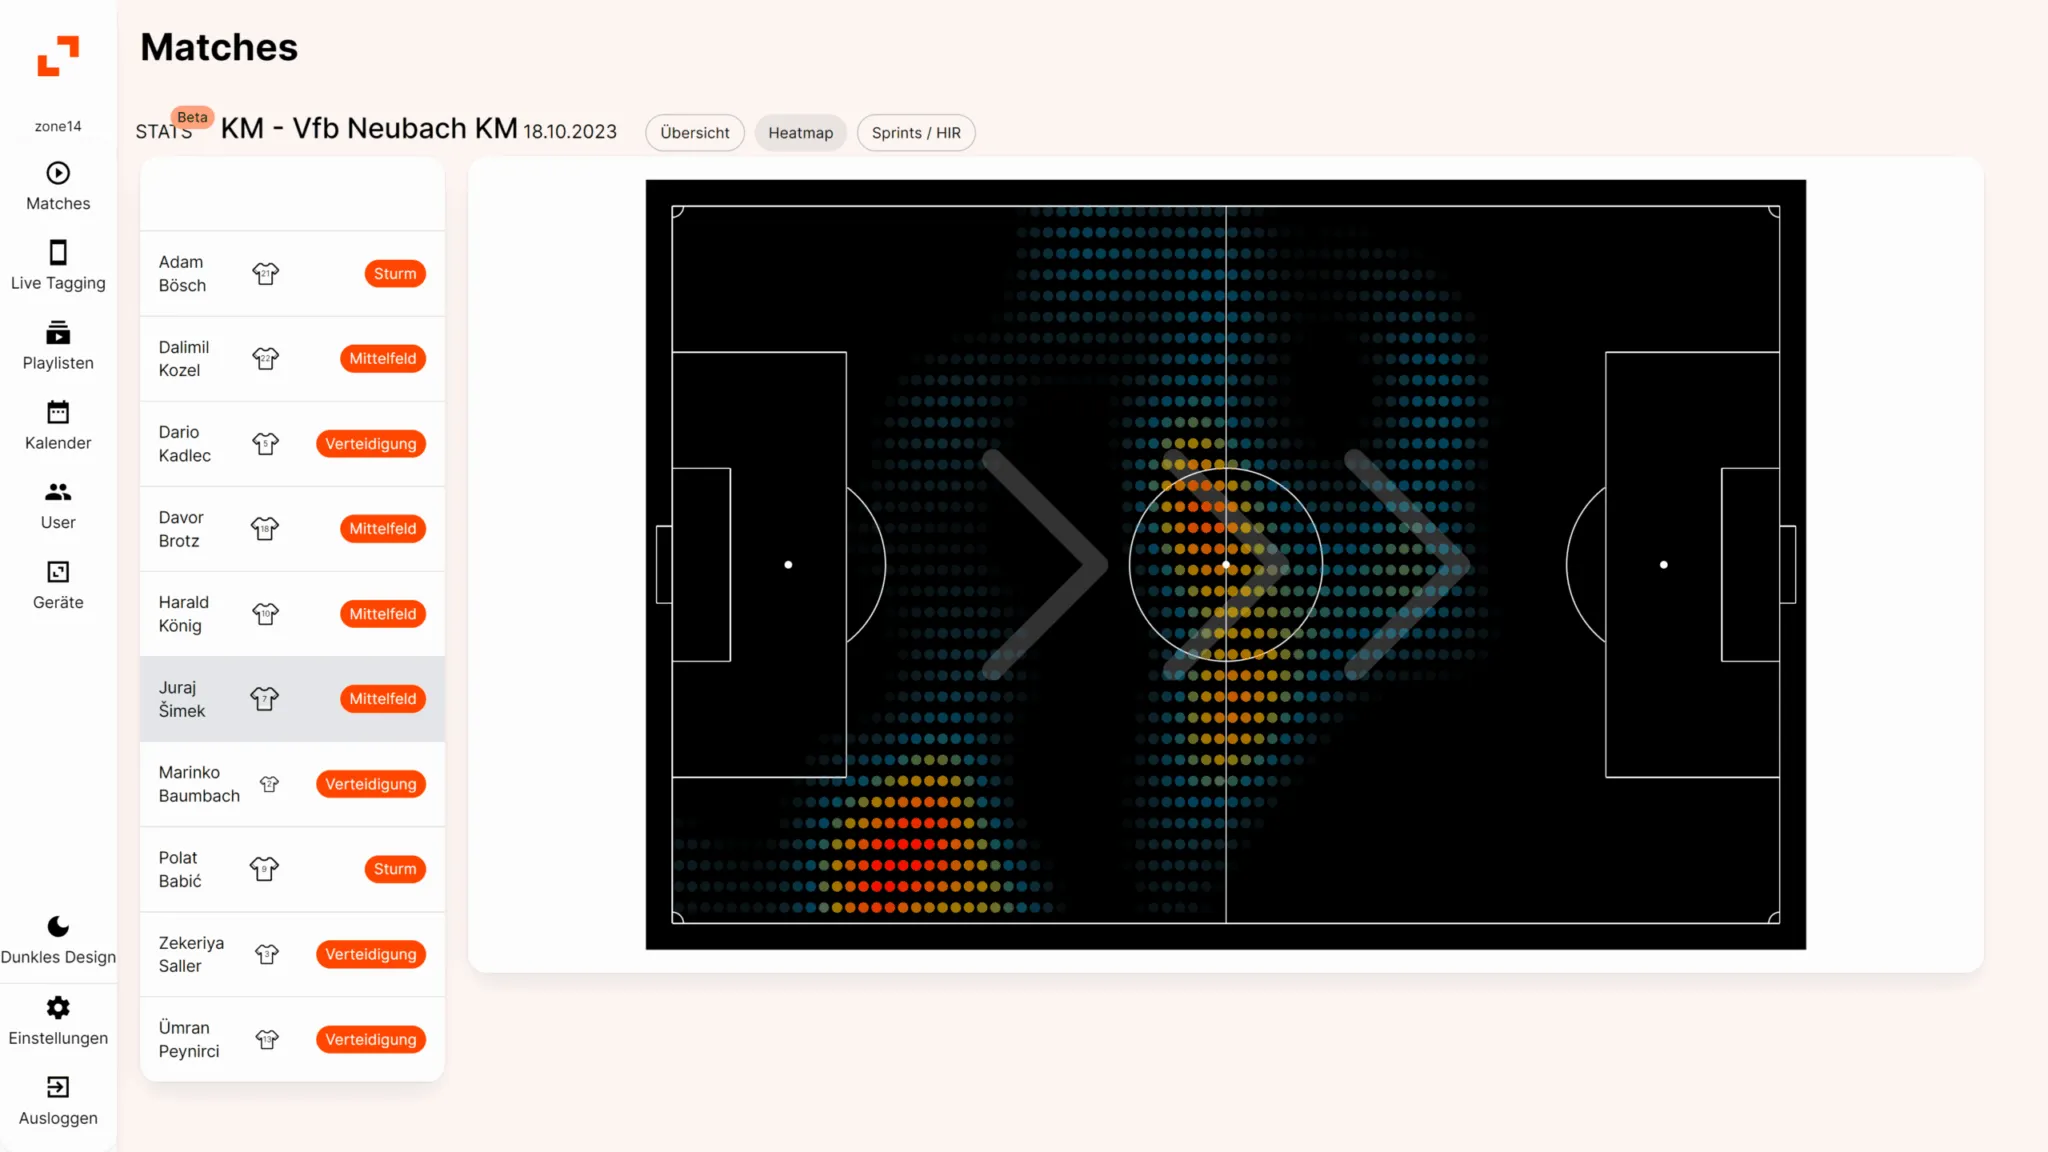
Accessible football data for clubs at every level
„Today our players got their first zone14 statistics. For them, it was like holding up a mirror.“
 DCV KrimpenNetherlands · 7th tier
No more post-match debates.
You tell your winger the intensity was missing in the second half. He sees it differently. Without data, it is your word against his feeling.
With zone14 STATS, you don’t just show your team what you saw — you back it up with numbers and video. How many sprints were really made? Where did the high-intensity runs happen? When did the team lose its compactness? And in which half did your team have more control?
With STATS, gut feeling becomes a concrete point of analysis.
Book a live demoHow it works
From match video to measurable match data
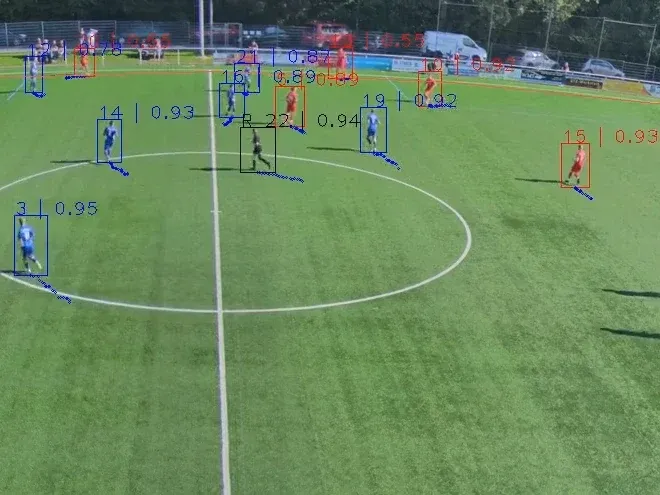
STATS uses the footage from your zone14 TWO camera and analyses player movements directly from the video. The result is performance data and team metrics you can put to work in your analysis straight away.
- 01
Record the match
The zone14 TWO camera records your match automatically — no camera operator needed.
- 02
AI analyses movements
STATS detects runs, speeds and movement patterns in the video.
- 03
Understand the data
You get distances, sprints, high-intensity runs, heatmaps, sprint maps and team metrics.
- 04
Coach with video
Every statistic comes with context, because it is linked directly to your match video.
Metrics
All the key football statistics in one place
STATS turns your match video into an analysis hub for coaches, analysts and players. You don’t just see how far your team ran — but where, when and in what match context.
Team overview
A quick overview of collective team performance. Automatic analysis of total distance, sprints and speeds in the context of the whole team, for efficient load management and post-match review.
Ideal for match review, load management and team meetings.
Distance covered
A detailed comparison of running performance. Objective football performance data helps you spot physical fatigue early and manage training load precisely to help prevent injuries.
For more objective decisions in training and match analysis.
Sprints and runs
Analysis of explosive actions. Identify pressing moments, runs in behind and recovery runs through automatic tracking of sprints and high-intensity runs, straight from the video.
Spot pressing actions, runs in behind and recovery runs.
Sprint maps
Visualise where the intensity in a match comes from. Sprint maps show the tactical effectiveness of runs in the press or on the counter-attack, with precise positional data on the pitch.
Not just how often your players sprinted — but where and why.
Heatmaps
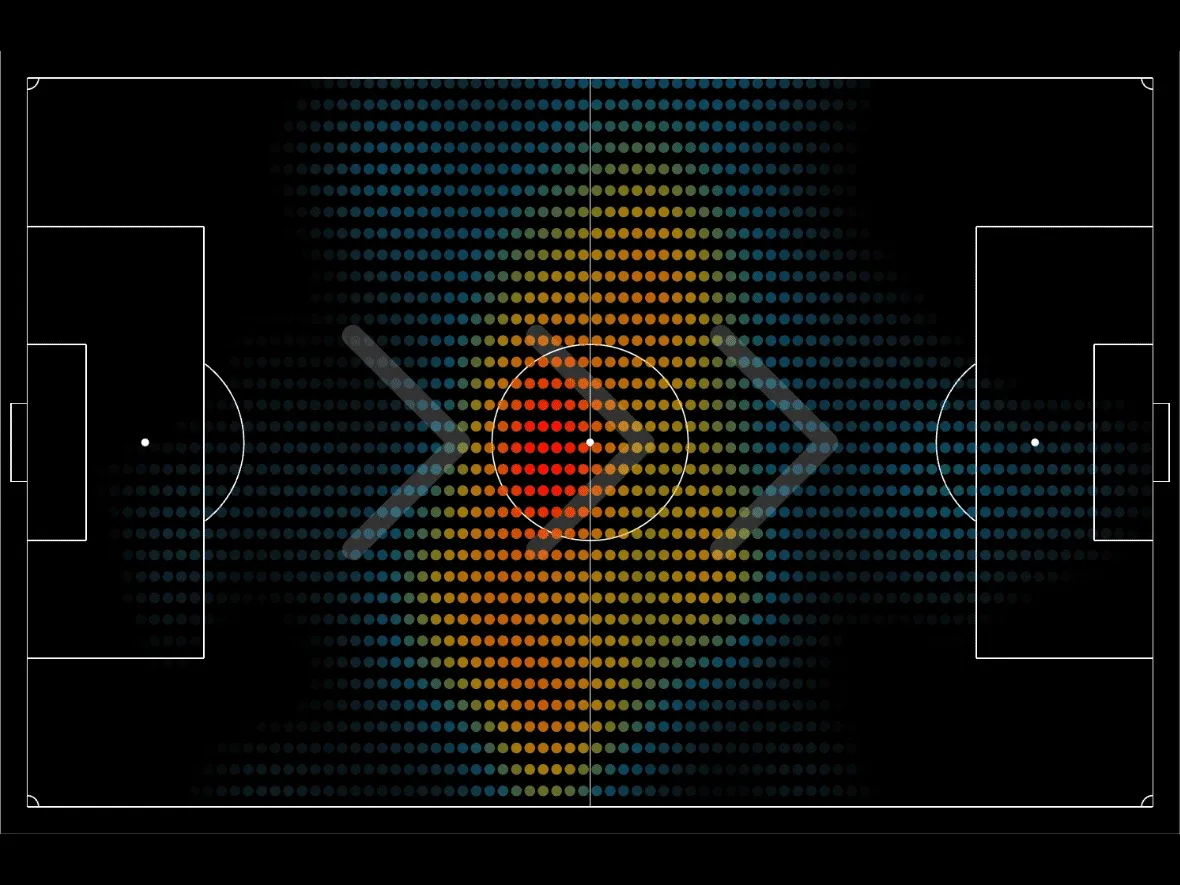
Positional data at a glance. Heatmaps visualise tactical patterns in how your players occupy space and show positional and role behaviour across the whole match, straight from the video.
Perfect for tactical patterns and positional analysis.
Individual player reports
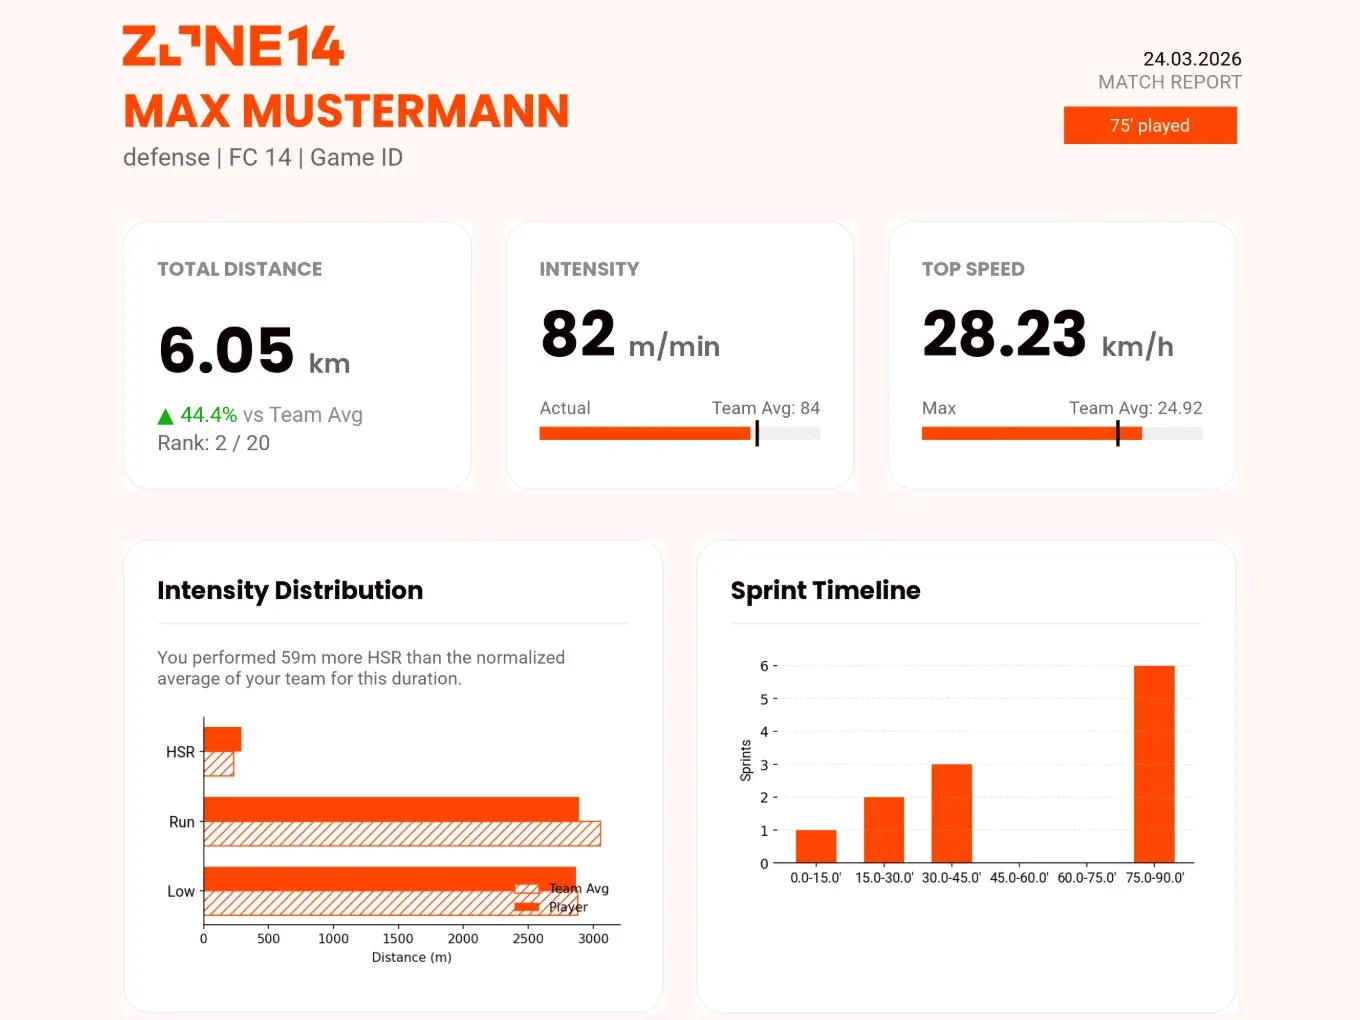
Automated PDF reports for every player. Use objective metrics such as top speed, sprints and distance covered for targeted player development and fair, data-driven feedback conversations — without the hassle of wearables.
Numbers bring clarity — and development begins.
Team compactness
Tactical analysis of your team’s shape. Measure your team’s compactness from match to match and automatically analyse how the distances between the units of your team change over the full 90 minutes.
Especially valuable for pressing, rest defence and control of the game.
Team dominance
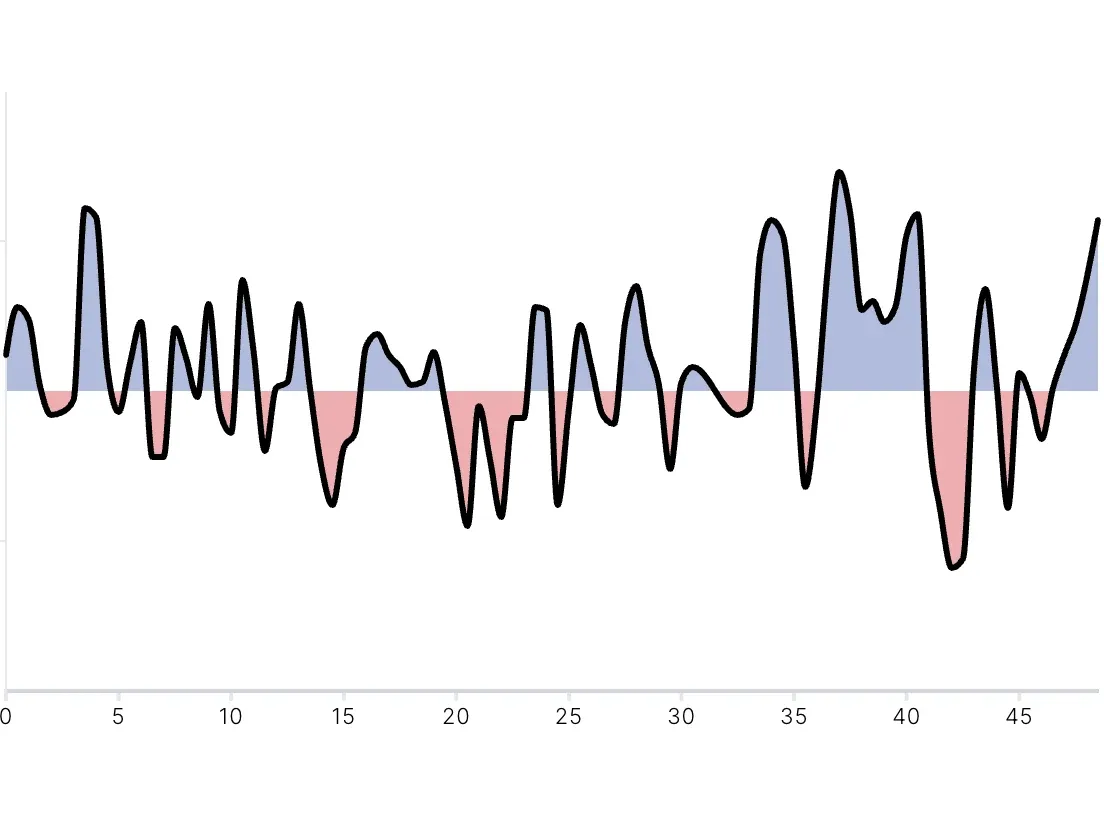
Keep track of territorial control. See instantly in which zones your team was more present than the opponent and how territorial dominance and share of play shifted over time.
Shows whether your team really pushed the opponent back.
Comparison
GPS vest or video tracking
| Category | GPS vests | zone14 STATS |
|---|---|---|
| Hardware | A tracker and vest for every player | No wearables on the pitch |
| Preparation | Charge, hand out, assign | Record the match, AI does the analysis |
| Comfort | The vest has to be worn | No extra equipment |
| Video context | Has to be linked separately | Linked directly to the match video |
| Team analysis | Often focused on individual players | Player, team and opponent comparison |
| Cost | Hardware per player/squad | STATS from €79/month |
| Scaling across the club | More teams mean more devices | Ideal as part of the zone14 system |
GPS vests remain a strong choice when a club wants to measure highly specialised sports science data directly on the body. STATS is the better choice when coaches want performance data, team metrics and video context without the hassle of wearables.Explore GPS alternatives for your club →
In practice
This is what STATS looks like in practice
Who it’s for
For coaches, analysts and clubs
For coaches
Prepare team meetings with clear facts. Show players when the intensity was missing, where sprints happened and how the team’s shape changed.
For analysts
Connect performance data directly with video analysis. Instead of transferring numbers by hand, you work in one platform for clips, match scenes and statistics.
For clubs
Make professional match data available to multiple teams without kitting out every team with GPS hardware.
One system
One system for everything
- 01Recordingzone14 TWOAutomatic 4K match recording with a 180° view — the basis for analysis, live streaming and tracking.See the camera
- 02Analysiszone14 REPLAYVideo analysis with clips, drawings, playlists and team feedback. Connect match scenes with clear insights.Discover REPLAY
- 03Livezone14 LIVELive streaming, replays and live insights for coaches, fans and clubs.See LIVE
- 04Performance datazone14 STATSPerformance data straight from the match video: distances, sprints, sprint maps, heatmaps, team compactness, team dominance and player reports.You are here
Questions & answers
What is a football tracker without GPS?
How does football tracking work without a GPS vest?
Which football statistics does zone14 STATS provide?
Is zone14 STATS an alternative to GPS vests?
What are sprint maps?
What does team compactness mean?
What does team dominance mean?
Are there individual player reports?
When is the data available after the match?
Can I use STATS with other cameras?
How much does zone14 STATS cost?
Does STATS replace a football statistics app?
Learn more about match data
More about match data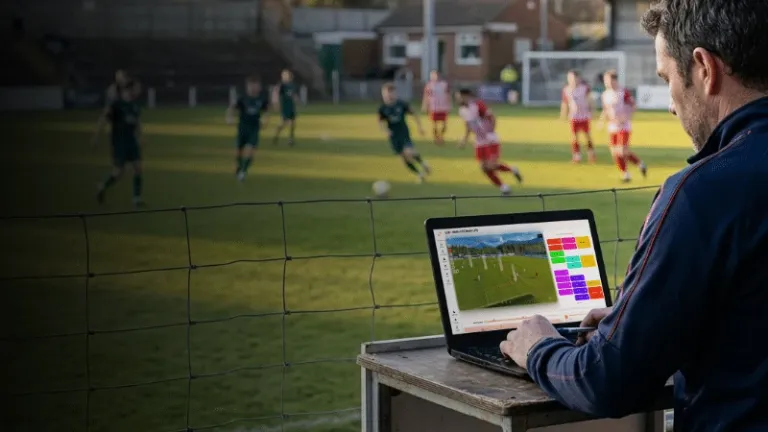
Veo Analytics 2 / Play by Play: Features, Player Tracking & Alternatives
What does Veo Play by Play offer – and what are the alternatives? Learn how zone14 STATS enables football tracking and performance data without GPS.
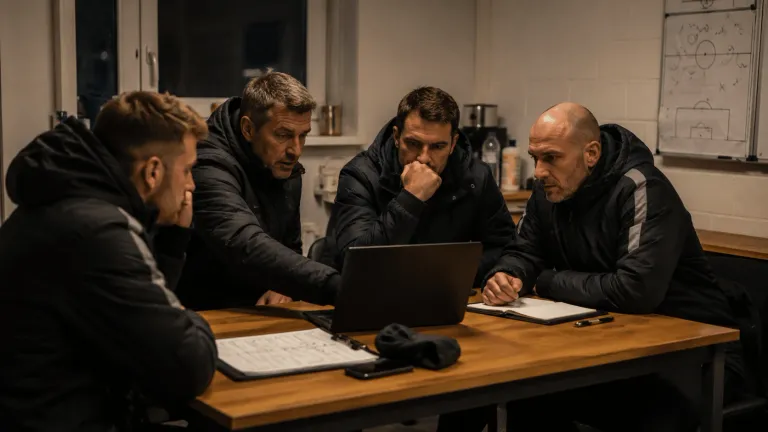
2026 World Cup Stats Guide: The Numbers Coaches Should Watch
The World Cup 2026 stats coaches should watch: xG, pressing data, line breaks, sprint maps, heatmaps and team compactness, explained in practical terms.
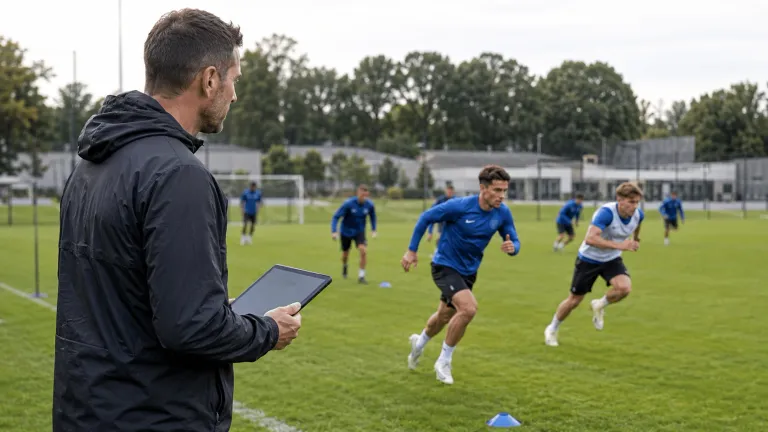
The Best Football Trackers 2026: A Comparison of GPS Vests, Wearables, and Video-Based Tracking
The best football trackers of 2026 compared: GPS vests, wearables and video-based tracking. Find out which solution fits your club.
Get started
Ready for tracking without GPS vests?
Don’t just tell your team what happened. Show them — with video, numbers and clear reports. With zone14 STATS, your match video becomes the foundation for objective analysis, better decisions and targeted player development.